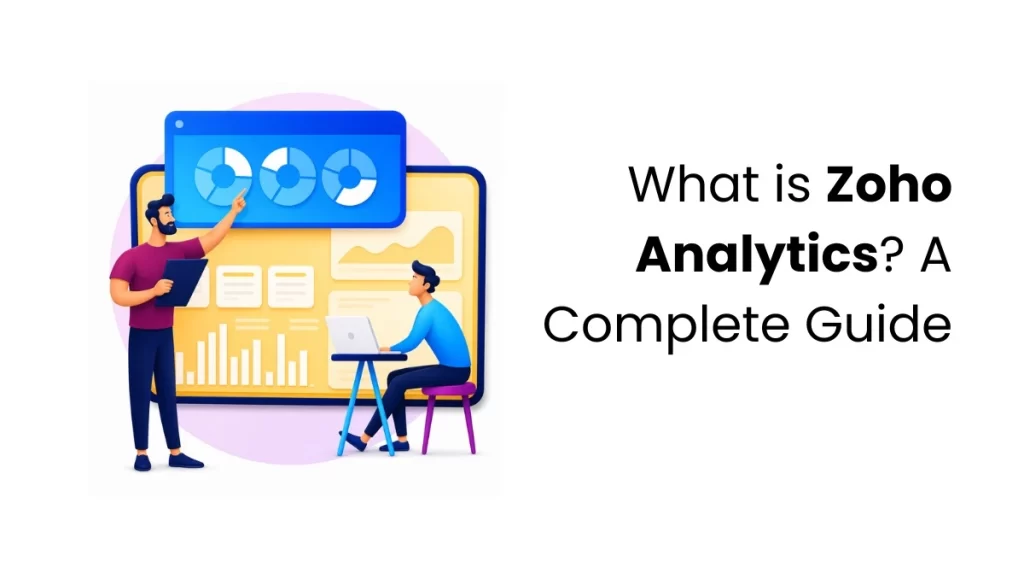
Companies and organizations collect data every day. Sales data, customer details, website visits, payments, and support tickets slowly turn into large amounts of information. After some time, managing and interpreting the growing volume of information becomes increasingly difficult. Files keep increasing, and sheets become messy. Important patterns, operational issues, and business opportunities may go unnoticed without proper analytics tools. That is where Zoho Analytics becomes useful.
Overview of Zoho Analytics
Zoho Analytics helps businesses turn raw information into reports, charts, dashboards, and visuals that are simpler to review. Instead of staring at huge spreadsheets for hours, users can quickly look at graphs or summaries and understand what is happening inside the business. Some businesses use it for tracking sales. Others use it to monitor customer activity, marketing results, expenses, or team performance. One of the major advantages of Zoho Analytics is its ability to support both small businesses and large organizations through a scalable and user-friendly environment.
A lot of people think analytics software will be difficult from the beginning. But Zoho Analytics feels surprisingly manageable after spending some time with it. The interface is cleaner than many people expect. Reports can be created without needing deep technical knowledge. That alone makes a big difference.
Managing Business Data with Zoho Analytics
Most companies already store data in different places. Some information stays inside Excel files. Some remain inside CRM software. Other details remain scattered across marketing tools, billing systems, websites, and support platforms. Looking at everything separately becomes tiring after a while. Zoho Analytics helps bring all that information together into one place so businesses can understand things more clearly.
Zoho Analytics Data Sources
Zoho Analytics supports many different data sources. Users can import data from several platforms instead of depending on only one system.
Common sources include:
- Excel files
- CSV files
- Cloud storage apps
- CRM software
- Finance platforms
- Marketing tools
- Databases
- Social media platforms
It also connects smoothly with products like Zoho CRM, Zoho Books, and Zoho Projects. Some companies connect only basic sales data. Others combine information from multiple departments. Both approaches work fine.
How Zoho Analytics Converts Data into Reports?
Once data is added to Zoho Analytics, it is stored in tables that work like organized spreadsheets. Users can use this data to create charts, dashboards, summaries, and reports in a much simpler way. These visual reports help businesses understand information more easily, rather than reading long rows of numbers. This makes it easier to notice things like growth, customer activity, or changes happening in the business over time. Reports also help different teams understand the same information more clearly during discussions and planning.
Using Zoho Analytics Dashboards for Business Insights
While reports help analyze specific datasets, dashboards combine multiple reports into a single real-time view. People usually do not enjoy opening ten different files just to understand one situation. Dashboards solve that problem. A dashboard can display inventory levels, employee performance, project progress, customer support status, revenue updates, and campaign results from a single screen, making daily tracking more convenient and organized.
Zoho Analytics supports visuals like:
- Pie charts
- Bar graphs
- Line charts
- Heat maps
- Summary tables
- KPI widgets
Some businesses keep dashboards simple. Others build detailed interactive dashboards with filters and drill-down options. It depends on what they actually need.
Smart Reporting Features in Zoho Analytics
Zoho Analytics has features that make reports and data easier to manage. Some tools help beginners use the platform easily, while other smart features help save time and make work simpler.
Beginner-Friendly Reporting Tools
Users can create reports by moving columns, selecting charts, and adding filters directly on the screen. The platform allows users to create reports without requiring advanced programming or technical expertise initially. That makes things easier for people who are not from technical backgrounds.
At the same time, advanced users still get deeper options like SQL queries, formulas, forecasting tools, and custom analysis features. So the platform does not feel too basic either. This balance between simplicity and advanced functionality makes the platform suitable for both beginners and experienced analysts.
Smart Report Generation With Auto Analysis
Sometimes businesses have data but no idea where to begin. Looking at raw numbers alone can feel confusing. Zoho Analytics includes a feature called Auto Analysis that automatically creates reports and dashboards after selecting a dataset.
The platform may generate:
- Trend reports
- Comparison charts
- Performance summaries
- Visual dashboards
Not every report will be perfect, but it gives businesses a useful starting point. Many smaller teams appreciate that because they do not always have dedicated analysts sitting around creating reports manually.
AI-Powered Reporting with Ask Zia
Beyond automated dashboard generation, Zoho Analytics also supports conversational AI-driven reporting through Ask Zia. Ask Zia is the AI assistant available inside Zoho Analytics. Instead of building reports step by step every single time, users can ask direct questions in simple language.
Things like:
- Show monthly sales.
- Which product sold best?
- Compare this month’s and last month’s revenue.
Then the system creates reports or charts automatically. For many users, this feels more natural than manually applying filters repeatedly. It saves time, too. Zia also suggests questions based on available data. Sometimes it even helps users notice insights they were not actively searching for. AI features inside analytics tools are growing quickly now, and Zoho Analytics has clearly been moving in that direction for some time.
How Zoho Analytics Supports Business Teams?
Zoho Analytics also includes features that help teams work better and access reports more easily. These tools help businesses stay organized and allow users to check important data from different places and devices.
Better Organization with Workspaces
A workspace is basically a separate area where reports, dashboards, charts, and tables stay grouped together. Businesses often create different workspaces for different departments, like:
- Sales
- Finance
- Marketing
- HR
- Customer support
This keeps information cleaner and easier to manage. Different employees can also receive different access permissions. Some users may only view reports, while others can edit or manage them fully. That becomes important once businesses start growing larger.
Mobile Access for Faster Monitoring
People are not always sitting in one place while working. Many professionals work remotely, travel frequently, or manage operations from multiple locations. Zoho Analytics can be used on Android phones, iPhones, and tablets, so users can check reports and dashboards anytime. Users can also explore charts and filters directly from their mobile devices. This helps them quickly understand important updates and take action faster when needed.
Why Businesses Prefer Zoho Analytics?
As business operations become more digital, organizations depend heavily on analytics tools to interpret information efficiently. However, collecting data alone does not really solve anything. The bigger challenge is understanding what the data is trying to say. That is one reason analytics tools became important across industries. Zoho Analytics helps organizations track performance, understand trends, and make decisions more clearly through visual reports and advanced analytics tools.
Better Decision Making with Zoho Analytics
Clear information usually leads to better decisions. When business owners can actually see patterns clearly, they react faster. Problems become easier to notice. Opportunities appear earlier, too.
For example, businesses may notice:
- Sales are rising in one location
- Customer complaints are increasing suddenly
- Marketing campaigns are slowing down
- Inventory moving faster than expected
Without analytics, these things may stay hidden for weeks. Visual reports help people notice changes quickly without digging through endless spreadsheets.
The Growing Importance of Data Visualization
Most people process visuals faster than giant tables full of data. A graph can explain something within seconds that might take much longer inside spreadsheets. That is why businesses now rely heavily on visual reporting. Zoho Analytics supports different types of visualizations because not every business thinks the same way. Some prefer tables. Others understand information better through charts and graphs. There is no single perfect style for everyone.
Handling Large Volumes of Data
Some businesses deal with huge amounts of data every day. Zoho Analytics helps combine those datasets into one place. It also supports data blending, which allows organizations to compare information from different systems.
For example, businesses may compare:
- Marketing expenses with sales growth
- Support issues with customer retention
- Inventory trends with order activity
This creates a much broader understanding of business performance.
Advanced Features in Zoho Analytics
Zoho Analytics also includes advanced features that help businesses handle reporting in a more flexible and secure way. These tools give users better control over data, allow deeper analysis, and make it easier to connect reports with different business systems.
Embedded Reporting in Zoho Analytics
Some people want to see reports and dashboards directly inside their apps or websites without opening another platform. Zoho Analytics makes this possible through embedded reporting. Reports can be added to customer portals, employee systems, and software applications so users can view important information in one place. This helps save time and makes everything easier to use.
Advanced Reporting with SQL
Zoho Analytics is simple for beginners because many reports can be created using easy drag-and-drop tools. At the same time, people who need more detailed reports can also use advanced features like SQL. This helps users combine different sets of data and create more customized reports when needed. Because of this, both beginners and experienced users can use the platform comfortably.
Business Data Security in Zoho Analytics
Security matters because business information is sensitive. Zoho Analytics includes features like:
- Role-based access
- User permissions
- Activity logs
- Audit tracking
- Backup scheduling
Admins can control who views reports and who edits them. The platform also tracks user activity, which helps businesses monitor access and maintain accountability inside teams. Backup options are available, too. Businesses can schedule backups daily, weekly, or monthly, depending on their requirements.
Conclusion
Today, understanding information has become very important. Zoho Analytics helps people turn confusing data into simple charts, dashboards, and reports that are easier to read and understand.
People can use the platform to check customer activities, performance, and many other details in one place. Its simple design makes it easy for beginners, while the advanced features help users who need deeper reports and analysis.
As organizations continue generating larger volumes of business data, analytics platforms are becoming essential for reporting, operational monitoring, and strategic decision-making. For learners and professionals interested in building practical analytics and reporting skills, Finprov Learning also offers industry-focused training programs designed to support career growth in business and technology domains.
FAQs
1. How does Zoho Analytics make business data easier to understand?
Zoho Analytics turns raw numbers into charts, dashboards, and visual reports that help businesses notice patterns and trends more easily.
2. What kind of businesses usually use Zoho Analytics?
Small businesses, growing companies, and larger organizations all use Zoho Analytics for tracking sales, customers, expenses, marketing results, and business performance.
3. How does Ask Zia help users inside Zoho Analytics?
Ask Zia allows users to ask questions in simple language and automatically generates reports, charts, or insights based on available data.
4. Why do businesses prefer dashboards instead of spreadsheets alone?
Dashboards display important updates visually on one screen, making information quicker and easier to understand compared to large spreadsheets.
5. How does Zoho Analytics support teams working together?
Teams can share reports, control user permissions, review dashboards together, and access information from both computers and mobile devices.